Dashboards are a vital tool in dealing with large data sets, or as we call them today, Big Data. Using tools that most offices already have, CategoryMaster can build customized reports that provide views of the data from a high level such as “Total Company” down to a very granular level such as a specific item sold to a specific customer. The application of filters in the report allow the user to define what they want to see at whatever level they need to and the report updates instantaneously. No need to reformat or recalculate.
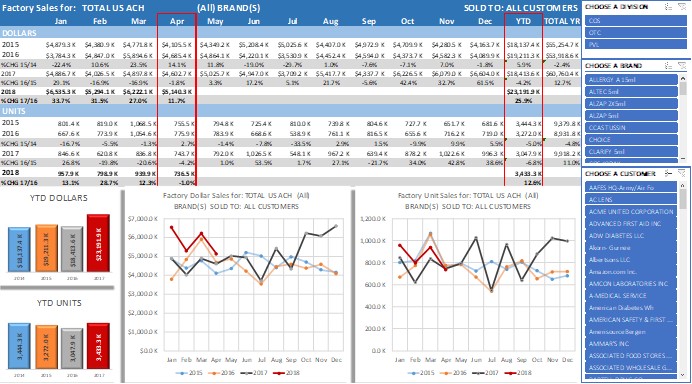
The visual representation of the data helps define and tell the story. The graphs in the dashboard refresh automatically along with the values and make interpretation of the data fast and easy.
The real value of these dashboards is that they let the end user manipulate the information and get the answers to their inevitable questions quickly and easily. No need to go back to IT or the department power user to have the data manipulated or to create new reports.
These dashboards can be built for factory sales, syndicated data, customer data, and any other data source that is available. Copy/Paste the results into a PowerPoint presentation or use multiple tabs in a workbook to tell or present the story. Use the software tools you already have to their maximum benefit.
If you are struggling with the collection and analysis of the data you need to make good business decisions, then CategoryMaster can work with you to develop one or many dashboards to help. CategoryMaster builds all of its models in MS Excel, so there is no need to buy new software or train users on a new program.